Image Details
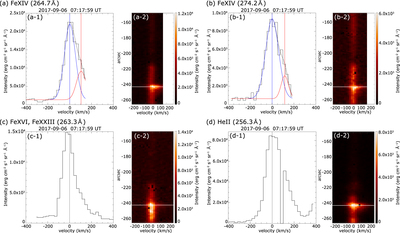
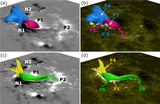
Caption: Figure 5.
Spectral line profiles and spectral images at the single site of the redshifted signal in Figure 4(c). Each panel corresponds to the Fe XIV (264.7 Å), Fe XIV (274.2 Å), Fe XVI/Fe XXIII (263.3 Å), and He II (256.3 Å) lines, respectively. The intensity profiles along the horizontal white line cut in the spectral images on the right are plotted in the images on the left. The vertical axes of the profiles represent intensity, and the vertical axes of the spectral images are represented in spatial arcseconds along the slit. The horizontal axes represent the velocities resulting from single (in panels (c) and (d)) and double (in panels (a) and (b)) Gaussian fitting. The intensity range of the spectral images is depicted in the color scale on the right of each panel. The histogram with the black solid line depicts the intensity of each spectral line. The black broken lines are the result of Gaussian fitting, and the blue/red curves denote the first/second components obtained from double Gaussian fitting for the intensity profiles in panels (a-1) and (b-1). The Doppler velocities of the second components relative to the first components are approximately 103 ± 8 km s−1 for 264.7 Å and 115 ± 16 km s−1 for 274.2 Å, respectively.
Other Images in This Article
Copyright and Terms & Conditions
© 2020. The American Astronomical Society. All rights reserved.