Image Details
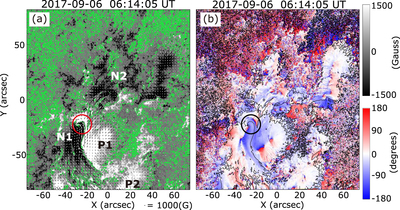
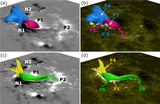
Caption: Figure 3.
(a) Distribution of three components of the magnetic field (Bx, By, Bz) in AR 12673, which was observed by Hinode/SOT-SP fast-map scanning from 06:14:05 UT on 2017 September 6. The background white/black and green lines are similar to those in Figures 2(a)–(c), except that the background Bz level is in the range of ±1500 G. The small arrows indicate the orientation and strength of the horizontal components (Bx, By) of the photospheric magnetic fields, whose magnitudes are greater than 100 G. (b) Distribution of the magnetic shear angles relative to the potential field. The red/blue regions indicate counterclockwise/clockwise shear in the range of ±180°. The black lines represent the magnetic polarity inversion lines, similar to the green lines in panel (a). The red/black circles in panel (a)/(b) denote the intruding negative peninsula. Additionally, the southern half of P2 is located outside of the SP scanning field of view.
Other Images in This Article
Copyright and Terms & Conditions
© 2020. The American Astronomical Society. All rights reserved.