Image Details
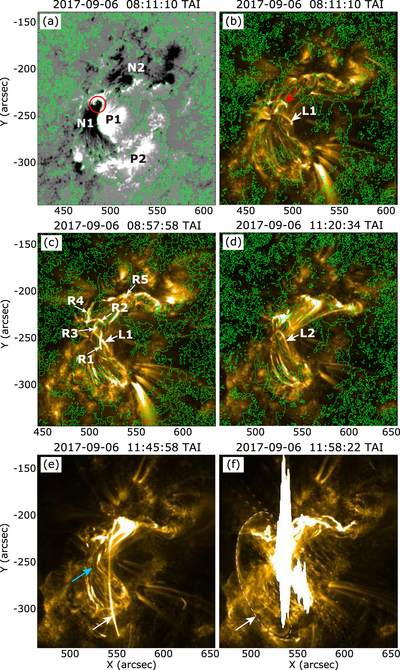
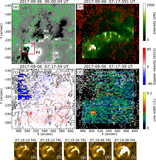
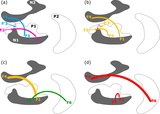
Caption: Figure 7.
Temporal variation of the SDO/AIA 171 Å images, whose characteristic emission temperature is log(T) ∼ 5.8. Panel (a) depicts a reference magnetic field image at 08:11 UT on 2017 September 6, the same time as in panel (b). The magnetic polarity inversion lines of the radial magnetic field (Bz) obtained from SDO/HMI SHARP that are closest in time to the background SDO/AIA 171 Å images are overlaid in panels (b)–(d). The intruding negative peninsula is indicated by the red circle in panel (a). The red arrow in panel (b) indicates the cusp-shaped bright loops that are seen in Figures 4(b) and 6(b). The white arrows in panels (b) and (c) indicate the same bright loop L1 at different times before the X2.2 flare onset. Another white arrow in panel (c) indicates the initial flare ribbons of the X2.2 flare that is seen in Figure 2(e). The white arrow in panel (d) points to the bright loop L2 that appears between the X2.2 and X9.3 flares. In panel (e), a dark tube-like structure along the magnetic polarity inversion line between P1 and N1, which is seen in Figures 6(c) and (d), is indicated by the sky-blue arrow. The white arrows in panels (e) and (f) indicate the same long north–south loop before and after the X9.3 flare onset, and the white dashed line in panel (f) outlines the expanded north–south loop. An animation of the SDO/AIA 171 Å images (without the magnetic polarity inversion lines) is available in the online Journal. The images run from 07:15 to 14:00 UT on 2017 September 6.
(An animation of this figure is available.)
The video/animation of this figure is available in the online journal.
Other Images in This Article
Copyright and Terms & Conditions
© 2020. The American Astronomical Society. All rights reserved.