Image Details
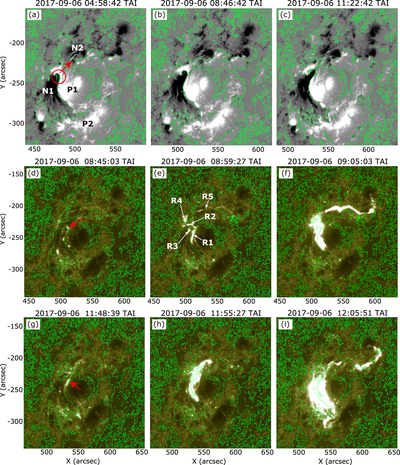
Caption: Figure 2.
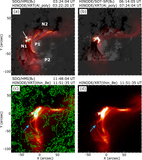
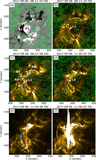
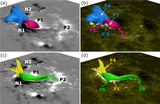
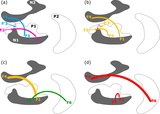
(a–c) Temporal evolution of the radial magnetic field Bz observed by SDO/HMI SHARP. The background white/black areas indicate the positive/negative polarities of Bz in the range of ±1000 G, and the magnetic polarity inversion lines are indicated by the green lines. The major polarities are labeled as N1 and N2 for the negative regions and P1 and P2 for the positive regions. The intruding negative peninsula is denoted by the red circle in panel (a). (d–i) Temporal variation of brightening in SDO/AIA 1600 Å in the range of 0–1000 DN. The left, middle, and right columns depict snapshots of the precursor brightening, initial flare ribbons, and enhanced flare ribbons, respectively. Panels (d)–(f) and (g)–(i) correspond to the X2.2 and X9.3 flares, respectively. The magnetic polarity inversion lines of Bz are overplotted with the green lines. The red arrows in panels (d, g) indicate the location of the last precursor brightening that is observed just before the X2.2 and X9.3 flare onsets, and the white arrows in panel (e) indicate the X2.2 initial flare ribbons. The fields of view of panels (d)–(i) are slightly larger than those of panels (a–c). An animation of the AIA 1600 Å images (without the magnetic polarity inversion lines) is available in the online Journal. The images run from 07:15 to 14:00 UT on 2017 September 6.
(An animation of this figure is available.)
The video/animation of this figure is available in the online journal.
Other Images in This Article
Copyright and Terms & Conditions
© 2020. The American Astronomical Society. All rights reserved.