Image Details
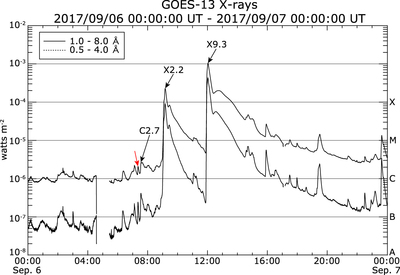
Caption: Figure 1.
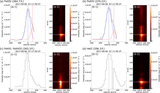
GOES soft X-ray light curve from 00:00 UT on 2017 September 6 to 00:00 UT on September 7. The solid/dotted lines represent 1–8 Å/0.5–4 Å light curves. The onset times of the X2.2 and X9.3 flares, which are indicated by the black arrows, are 08:57 and 11:53 UT on 2017 September 6, respectively. A small C2.7 flare occurs at 07:29 UT before the X-class flares, as indicated by the third black arrow. The red arrow indicates soft X-ray intensity enhancement corresponding to a transient brightening and downflow observed by Hinode/EIS. The brief data gap near 05:00 UT is due to the lunar transit.
Other Images in This Article
Copyright and Terms & Conditions
© 2020. The American Astronomical Society. All rights reserved.
Copyright ©
2025 Astronomy Image Explorer. All Rights Reserved.