Image Details
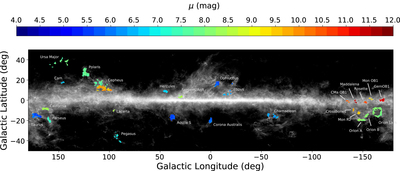
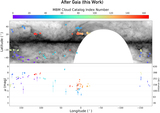
Caption: Figure 8.
Distance estimates to local molecular clouds through ≈1000 pixelated lines of sight. Each pixel is color-coded according to its median distance modulus and overlaid on the Planck E(B − V) reddening map. See Section 3 for details on the method and Section 4.2 for details on how the pixels were selected. An interactive version of the figure that highlights more detailed results for each cloud akin to Figure 7 is available at https://faun.rc.fas.harvard.edu/czucker/Paper_Figures/summary_fig.html in the online version of the published article.
An interactive version of this figure is available in the online journal.
Other Images in This Article

Copyright and Terms & Conditions
© 2019. The American Astronomical Society. All rights reserved.