Image Details
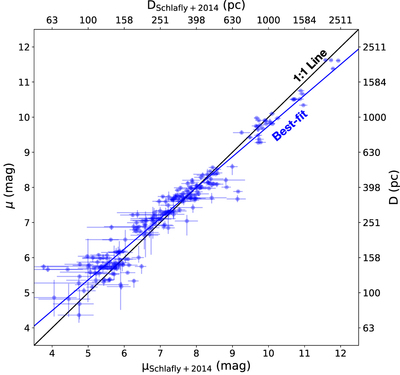
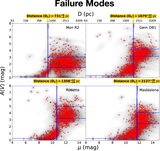
Caption: Figure 6.
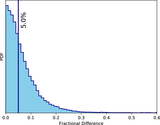
Comparison of the distances obtained in Schlafly et al. (2014) (x-axis) vs. distances obtained post-Gaia in this work (y-axis), over the same set of sightlines summarized in Tables 2 and 3. We show the 1:1 line in black and the best-fit line to the distribution in blue (parameterized as y = 0.88(±0.02)x + 0.98(±0.11)). The uncertainties shown only include the statistical uncertainties, and not any systematic uncertainty, which we estimate to be ≈10% for Schlafly et al. (2014) and ≈5% for this work.
Other Images in This Article

Copyright and Terms & Conditions
© 2019. The American Astronomical Society. All rights reserved.
Copyright ©
2024 Astronomy Image Explorer. All Rights Reserved.