Image Details
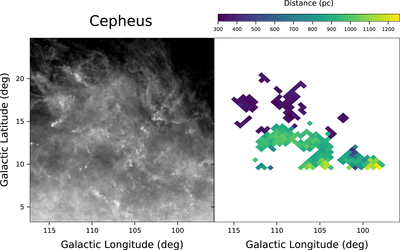
Caption: Figure 7.
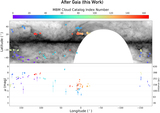
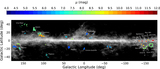
Pixelated distance map for the Cepheus molecular cloud. The left panel shows the Planck E(B − V) reddening map in the region around Cepheus. The right shows the set of healpix pixels associated with the cloud (see Table 1 and Section 4.2) colored by their median distance. We find Cepheus clearly hosts two separate components: a “near” component (purple pixels) and a “far” component (yellow or green pixels). An interactive version of this figure that includes each pixel’s line-of-sight extinction profile is available at https://faun.rc.fas.harvard.edu/czucker/Paper_Figures/Cepheus.html in the online version of the published article. Similar figures for every cloud in Table 1 are accessible via Figure 8. A machine-readable table of the per-pixel results for every pixel shown above in Cepheus is available on the Dataverse (https://dataverse.harvard.edu/dataverse/cloud_distances) (doi:10.7910/DVN/74Y5KU). Similar tables are available for every cloud in Table 1.
An interactive version of this figure is available in the online journal.
Other Images in This Article

Copyright and Terms & Conditions
© 2019. The American Astronomical Society. All rights reserved.