Image Details
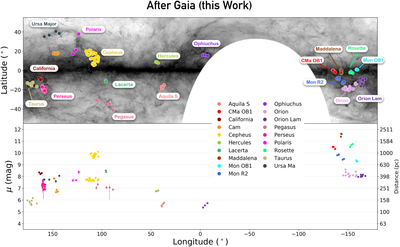
Caption: Figure 4.
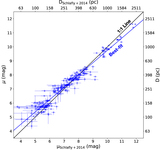
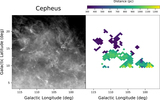
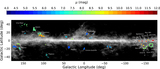
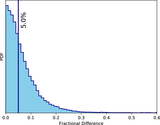
Summary of cloud distance results for sightlines through major molecular clouds from the Dame et al. (2001) CO survey. The top panel shows the Planck reddening map (Planck Collaboration et al. 2014), with the central (l, b) position of each sightline overlaid. The bottom panel shows the inferred distance to the cloud as a function of Galactic longitude, along with estimated statistical uncertainties; systematic uncertainties are excluded, which we estimate to be 5% for this work and 10% for Schlafly et al. (2014). Sightlines through the same molecular cloud are grouped by color and labeled by name. An interactive version of this figure showing the differences before and after Gaia is available at https://faun.rc.fas.harvard.edu/czucker/Paper_Figures/bigcloud_html_final.html and in the online version of the published article.
An interactive version of this figure is available in the online journal.
Other Images in This Article

Copyright and Terms & Conditions
© 2019. The American Astronomical Society. All rights reserved.