Image Details
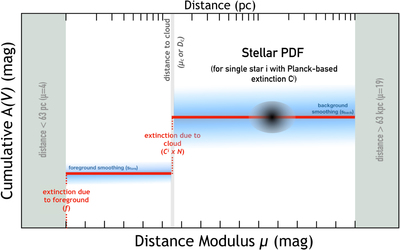
Caption: Figure 2.
Cartoon line-of-sight extinction profile demonstrating our basic thin dust-screen model. The mean extinction profile (solid red line) is defined by the free parameters f (foreground cloud extinction), ﹩{\mu }_{c}﹩ or DC (distance modulus/distance to the molecular cloud), and N (a normalization factor, fixed for all stars, that accounts for any scale difference between the Planck-based extinction and our derived extinction; see Section 3.2). The quantity Ci constitutes the Planck-based extinction for star i, modeled as the line-of-sight reddening from Planck toward the star times its R(V). Possible extinction variation along the line of sight (shaded blue) is modeled separately before and after the cloud. The resulting extinction profile is overlaid on an idealized 2D distance–extinction posterior for star i (grayscale ellipsoid); this is akin to the distance–extinction posteriors shown in Figure 1. The likelihood contribution from this star is the integral following the cloud’s extinction profile. This star’s likelihood would then be multiplied together with the likelihoods of other stars in the sightline to get the total likelihood of the cloud parameters. See Section 3.2 for additional details.
Other Images in This Article

Copyright and Terms & Conditions
© 2019. The American Astronomical Society. All rights reserved.