Image Details
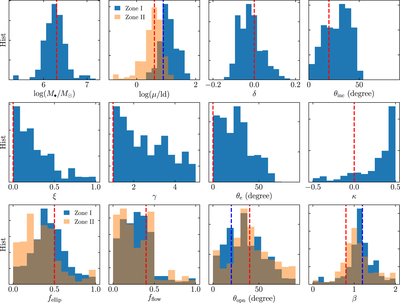
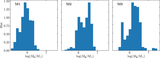
Caption: Figure 12.
Posterior distributions of the major parameters of model M3 inferred from the mock data shown in Figure 11. Vertical dashed lines represent the input values for zone I (in blue) and zone II (in red). For the common parameters of zones I and II, red dashed lines represent the input values. The parameters ﹩{f}_{\mathrm{ellip}}﹩ and ﹩{f}_{\mathrm{flow}}﹩ for zones I and II have the same input values.
Other Images in This Article
Show More
Copyright and Terms & Conditions
© 2018. The American Astronomical Society.
Copyright ©
2025 Astronomy Image Explorer. All Rights Reserved.