Image Details
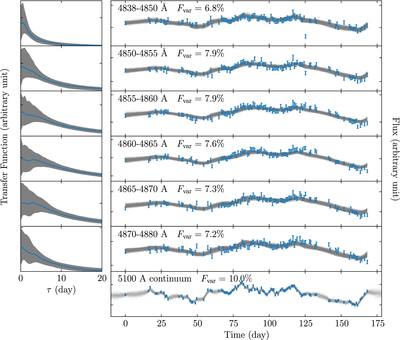
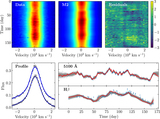
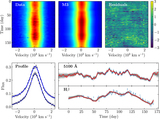
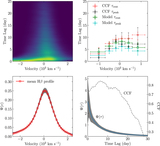
Caption: Figure 8.
Left panels: the obtained transfer functions based on model M3 for selected wavelength bins marked in the right panels. Gray shaded areas represent the 1σ error band. Right panels: the reconstructed light curves. Each thin gray line represents one random reconstruction. Points with error bars are the observed data. The variability characteristic Fvar of each observed light curve is also shown.
Other Images in This Article
Show More
Copyright and Terms & Conditions
© 2018. The American Astronomical Society.
Copyright ©
2025 Astronomy Image Explorer. All Rights Reserved.