Image Details
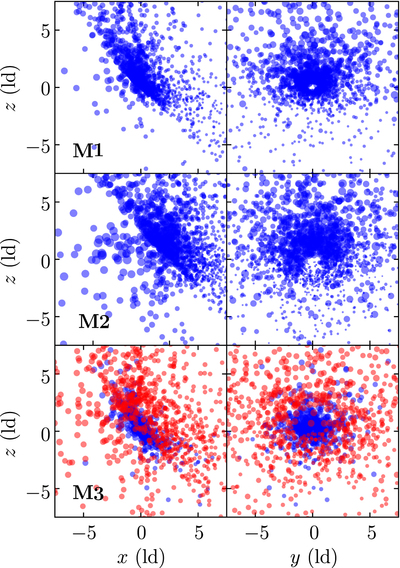
Caption: Figure 6.
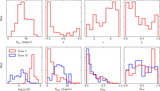
Examples of inferred geometry of the BLR for the three models from top to bottom. Each point represents a BLR particle and its size is in proportion to the weight of emissivity in Equation (15). For model M3, red and blue points correspond to BLR particles from zone I and zone II, respectively.
Other Images in This Article
Show More
Copyright and Terms & Conditions
© 2018. The American Astronomical Society.
Copyright ©
2025 Astronomy Image Explorer. All Rights Reserved.