Image Details
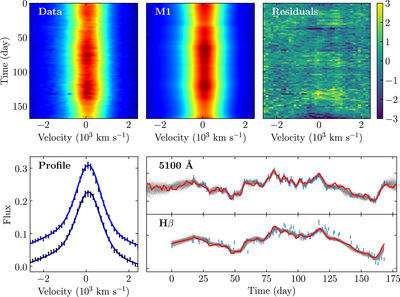
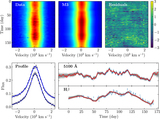
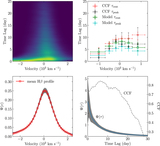
Caption: Figure 3.
Fits to the RM data of Mrk 142 with BLR model M1. The top three panels show the observed Hβ spectral time series, a model fit, and the residuals between the observed data and model fit, which are normalized by the square of the measurement errors. The bottom left panel shows Hβ profiles at two selected epochs, superposed upon the model fits with blue solid lines. The bottom right panels show the time series of the 5100 Å continuum and Hβ fluxes. The red line shows the best recovered time series and light gray lines represent random reconstructions. The observations are set to start at day zero.
Other Images in This Article
Show More
Copyright and Terms & Conditions
© 2018. The American Astronomical Society.
Copyright ©
2025 Astronomy Image Explorer. All Rights Reserved.