Image Details
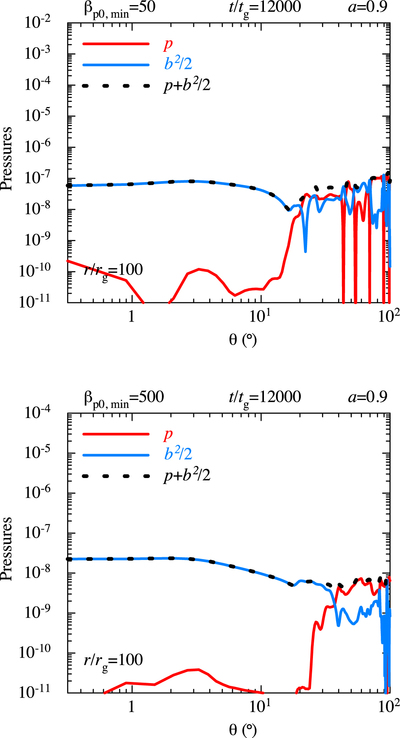
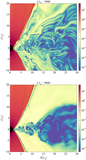
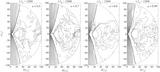
Caption: Figure 22.
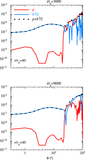
θ cross section at r/rg = 100 showing the gas pressure (red solid line), the magnetic pressure (blue solid line), and their sum (the total pressure; black dotted line) for two different initial conditions (a = 0.9 is fixed) at the final stage (t/tg = 12,000); βp0,min = 50 (left) and βp0,min = 500 (right). Readers can refer to the top panel of Figure 10 (a = 0.9) for comparison.
Other Images in This Article

Show More
Copyright and Terms & Conditions
© 2018. The American Astronomical Society. All rights reserved.
Copyright ©
2025 Astronomy Image Explorer. All Rights Reserved.