Image Details
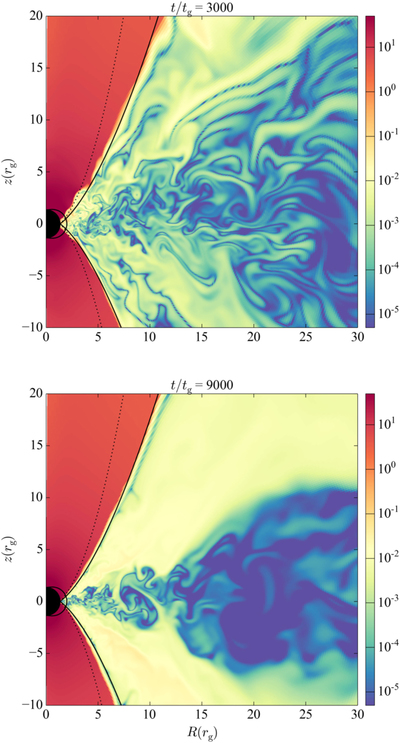
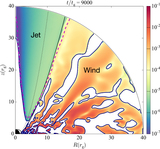
Caption: Figure 2.
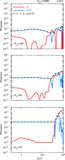
Time evolution of the fiducial run (a = 0.9375); t/tg = 3000 (top) and 9000 (bottom), respectively. A color-filled contour shows the magnetic energy per unit particle b2/ρ, which is measured in the fluid frame. The BH, the ergosphere (“not hatched”), and two outermost streamlines (genuine parabolic/parabolic), which are anchored to the event horizon, are displayed in the same manner as in Figure 1.
Other Images in This Article

Show More
Copyright and Terms & Conditions
© 2018. The American Astronomical Society. All rights reserved.
Copyright ©
2025 Astronomy Image Explorer. All Rights Reserved.