Image Details
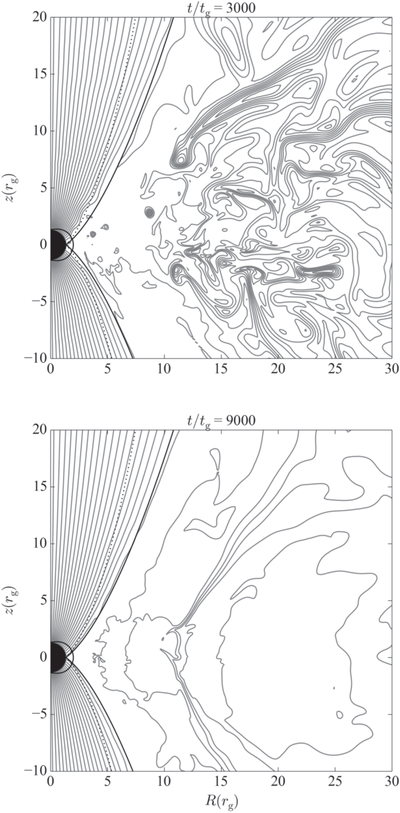
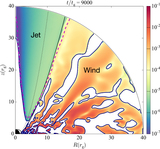
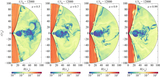
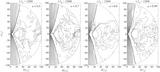
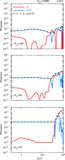
Caption: Figure 3.
Time evolution of the fiducial run (a = 0.9375); t/tg = 3000 (top) and 9000 (bottom), respectively. Contours (gray) represent poloidal magnetic field lines. Other components in the panels are identical to those in Figure 2.
Other Images in This Article

Show More
Copyright and Terms & Conditions
© 2018. The American Astronomical Society. All rights reserved.
Copyright ©
2025 Astronomy Image Explorer. All Rights Reserved.