Image Details
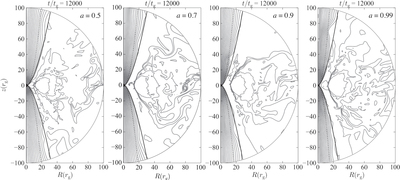
Caption: Figure 9.
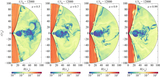
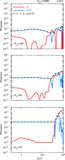
Contours (gray) show poloidal magnetic field lines for four different runs with different BH spins (from left to right: a = 0.5, 0.7, 0.9, and 0.99). The final snapshot (t/tg = 12,000) is displayed for each run with the whole computational domain r/rg ≤ 100 and 0 ≤ θ ≤ π. Other components in the panels are identical to those in Figure 8.
Other Images in This Article

Show More
Copyright and Terms & Conditions
© 2018. The American Astronomical Society. All rights reserved.
Copyright ©
2025 Astronomy Image Explorer. All Rights Reserved.