Image Details
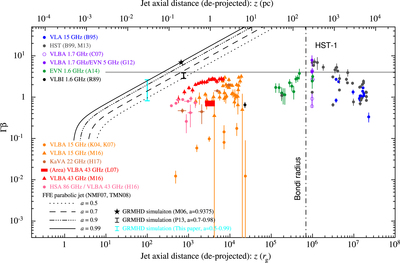
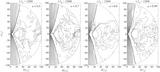
Caption: Figure 16.
Distribution of Γβ as a function of the jet axial distance z (deprojected with M = 6.2 × 10⁹ M⊙ and θv = 14°) from the SMBH in units of rg. The data of proper motions are taken from the literature (Reid et al. 1989; Biretta et al. 1995, 1999; Kellermann et al. 2004; Cheung et al. 2007; Kovalev et al. 2007; Ly et al. 2007; Giroletti et al. 2012; Meyer et al. 2013; Asada et al. 2014; Hada et al. 2016; Mertens et al. 2016; Hada et al. 2017, labeled as R89, B95, B99, K04, C07, K07, L07, G12, M13, A14, H16, M16, and H17, respectively). Theoretical expectation by utilizing the FFE parabolic (z ∝ R1.8) jet solutions (NMF07; TMN08) is also displayed with varying Kerr parameters (a = 0.5: dotted line; a = 0.7: dashed line; a = 0.9: triple-dot-dashed line; a = 0.99: solid line). The vertical solid line with horizontal bars (cyan) indicates a range of maximum values in the jet sheath (between two outermost streamlines: z ∝ R2 and z ∝ R1.6), which are obtained in our GRMHD simulations at rout = 100rg (a = 0.5–0.99; see Figure 12). For our reference, the maximum value in McKinney (2006, labeled as M06) with a = 0.9375 is marked with a filled star. Also, the vertical solid line with horizontal bars (black) indicates a range of maximum values in Penna et al. (2013, labeled as P13) with a = 0.7–0.98. The horizontal gray line corresponds to Γβ with ﹩\beta =\cos {\theta }_{{\rm{v}}}﹩, at which the Doppler beaming has a peak (see also Figure 18).
Other Images in This Article

Show More
Copyright and Terms & Conditions
© 2018. The American Astronomical Society. All rights reserved.