Image Details
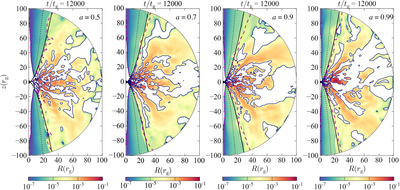
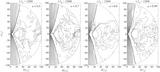
Caption: Figure 11.
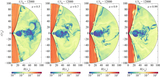
Color-filled contour of the magnitude of the outgoing radial mass flux density (similar to Figure 7) for four different runs with different BH spins (from left to right: a = 0.5, 0.7, 0.9, and 0.99). The final snapshot (t/tg = 12,000) is displayed for each run with the whole computational domain r/rg ≤ 100 and 0 ≤ θ ≤ π. The navy solid line shows ﹩{u}^{r}=0﹩, while “whiteout” regions indicate the magnitude of the ingoing radial mass flux density. The jet stagnation is clearly displayed inside the PFD funnel (﹩{u}^{r}=0﹩), and it shifts toward the BH when a increases. −ut = 1 (Be ≈ 0) is shown with a magenta dashed line. Other components in the panels are identical to those in Figure 8.
Other Images in This Article

Show More
Copyright and Terms & Conditions
© 2018. The American Astronomical Society. All rights reserved.