Image Details
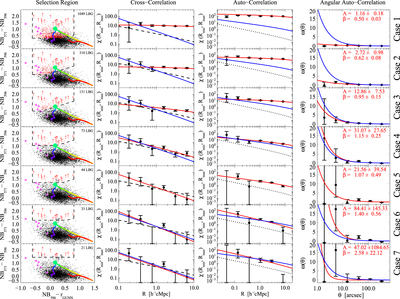
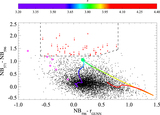
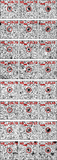
Caption: Figure 19.
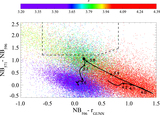
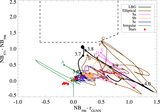
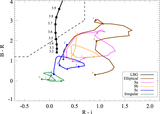
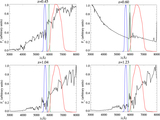
Impact of contaminants on the clustering measurements. We show seven different selection criteria and their respective clustering measurements. From left to right we show the color–color plot showing the color cuts used and the photometry. The cross-correlation, including the best fit according to our MLE estimator and the theoretical expectation of ﹩\chi ({R}_{\min },{R}_{\max })﹩ calculated from the QSO and LBGs auto-correlation functions and assuming a deterministic bias model (dashed line). The auto-correlation measurement, including the best fit according to our MLE estimator, and the LBG auto-correlation in blank fields at z ∼ 4 measured by Ouchi et al. (2004b) (dotted line). Finally, we show the angular auto-correlation function, with a power law fit ﹩\omega (\theta )=A{\theta }^{-\beta }﹩, with the ﹩A,\beta ﹩ values indicated in the top right corner. In the three correlation function plots we show the best fit in each case as a red curve and the best fit for our fiducial selection (i.e., Case 5) as a blue curve. From top to bottom we show selections progressively more conservative, and thus less contaminated. The selection used in this paper to measure the clustering properties of z ∼ 4 LBGs in QSO environments correspond to Case 5. We detected a convergence in the clustering measurements for the three last cases.
Other Images in This Article
Show More
Copyright and Terms & Conditions
© 2017. The American Astronomical Society. All rights reserved.