Image Details
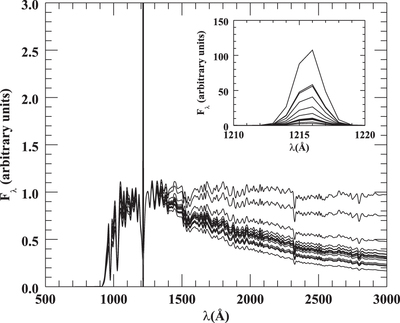
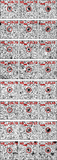
Caption: Figure 3.
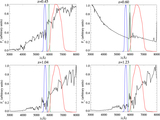
Example of ten rest-frame simulated spectra using our Monte Carlo simulation. The spectra have been normalized to have the same flux value at ﹩\lambda =1245﹩ Å. The subplot in the upper right corner shows a zoom-in of the region of the ﹩\mathrm{Ly}\alpha ﹩ line.
Other Images in This Article
Show More
Copyright and Terms & Conditions
© 2017. The American Astronomical Society. All rights reserved.
Copyright ©
2025 Astronomy Image Explorer. All Rights Reserved.