Image Details
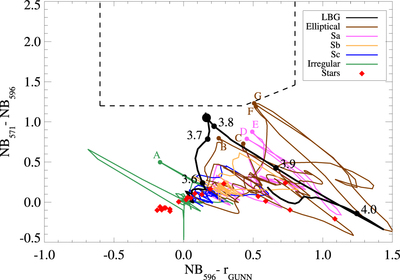
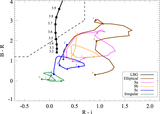
Caption: Figure 5.
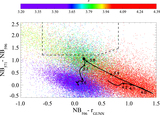
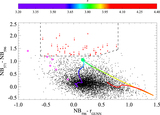
Evolutionary tracks of low-redshift galaxies redshifted from z = 0 to z = 3. We plot as brown, magenta, orange, blue, and green curves the evolutionary track of elliptical, Sa, Sb, Sc, and irregular galaxies, respectively. We overplot the track of LBGs computed as was explained in Section 3.1 as a black curve. Filled circles over the black curve indicate colors of LBGs from redshift 3.6 to 4.0, and the largest black point indicates the exact position of the color of LBGs at z = 3.78. Filled circles labeled with letters over the low-redshift galaxies evolutionary tracks indicate the colors of some contaminants that could be affecting our selection: galaxies at z = 0.60 (A), z = 1.83 (B), z = 0.45 (C), z = 1.23 (D and F), and z = 1.04 (E and G). Red diamonds show the mean colors of 23 different type of stars, including O, B, A, F, G, K, M, and L-type stars as well as white dwarfs, carbon, and K-type subdwarf stars. The dashed line indicates the selection region used to select LBGs according to Equation (2).
Other Images in This Article
Show More
Copyright and Terms & Conditions
© 2017. The American Astronomical Society. All rights reserved.