Image Details
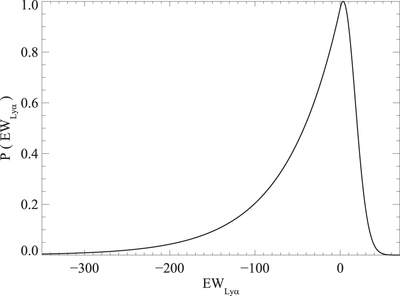
Caption: Figure 2.
Normalized probability distribution function of ﹩{\mathrm{EW}}_{\mathrm{Ly}\alpha }﹩ used for the simulated spectra, where negative values correspond to emission lines. ﹩{\mathrm{EW}}_{\mathrm{Ly}\alpha }﹩ was chosen from a Gaussian distribution with rest-frame mean ﹩\mu =-25﹩ Å and ﹩\sigma =40﹩ Å (Shapley et al. 2003) plus an exponential tail of high ﹩{\mathrm{EW}}_{\mathrm{Ly}\alpha }﹩ values with scale length of ﹩{W}_{0}=-64﹩ Å (Ciardullo et al. 2012).
Other Images in This Article
Show More
Copyright and Terms & Conditions
© 2017. The American Astronomical Society. All rights reserved.
Copyright ©
2025 Astronomy Image Explorer. All Rights Reserved.