Image Details
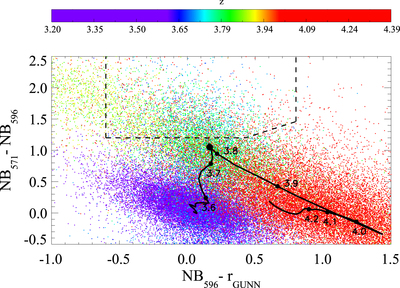
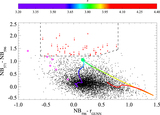
Caption: Figure 4.
Color–color diagram showing the simulated colors for 1000 LBG spectra, plotted as redshift color-coded points according to the color bar. The median LBG evolutionary track is plotted as a black curve. The filled points over this curve indicate the median LBG colors at different redshift ranging from 3.6 to 4.2. The largest circle shows the exact position of the median z = 3.78 LBG colors. The dashed line indicates the selection region used to select LBGs according to Equation (2).
Other Images in This Article
Show More
Copyright and Terms & Conditions
© 2017. The American Astronomical Society. All rights reserved.
Copyright ©
2025 Astronomy Image Explorer. All Rights Reserved.