Image Details
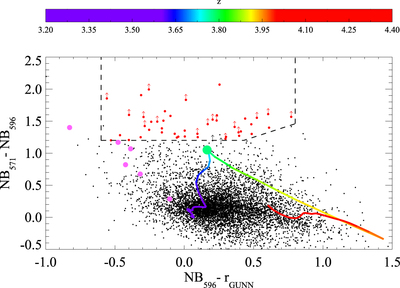
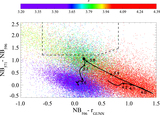
Caption: Figure 8.
Color–color diagram for the six stacked QSO fields. Here the evolutionary track shown in Figure 5 is plotted as redshift color-coded track according to the color bar. We have highlighted the selected LBGs as red points. The magenta points indicate the color of each QSO in the filters. Arrows indicate lower limits for ﹩{\mathrm{NB}}_{571}-{\mathrm{NB}}_{596}﹩ color. These are cases in which the object was not detected in NB571 filter at the 2σ level and magnitude was replaced by the corresponding limit magnitude.
Other Images in This Article
Show More
Copyright and Terms & Conditions
© 2017. The American Astronomical Society. All rights reserved.
Copyright ©
2025 Astronomy Image Explorer. All Rights Reserved.