Image Details
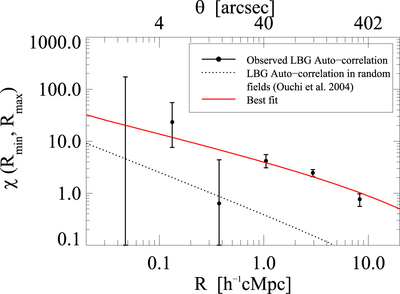
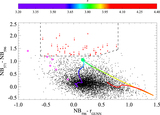
Caption: Figure 16.
Data points showing the LBGs auto-correlation measurement in QSO fields as we describe in Section 4.2. The solid red curve shows the best fit for our measurements given by ﹩{r}_{0}^{\mathrm{GG}}=21.59\,{h}^{-1}\,\mathrm{cMpc}﹩ and ﹩\gamma =1.5﹩. The dotted black curve shows the LBGs auto-correlation in blank fields at z ∼ 4 measured by Ouchi et al. (2004b). We find a stronger clustering in our fields in comparison with blank fields, which suggests that QSOs are located in overdense regions.
Other Images in This Article
Show More
Copyright and Terms & Conditions
© 2017. The American Astronomical Society. All rights reserved.
Copyright ©
2025 Astronomy Image Explorer. All Rights Reserved.