Image Details
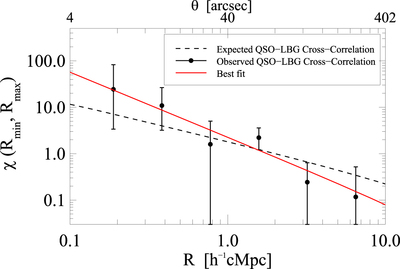
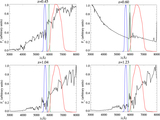
Caption: Figure 14.
QSO–LBG cross-correlation function and its maximum likelihood model. The filled circles show our measurement described in Section 4.1 with ﹩1\sigma ﹩ Poisson error bars. The solid red curve shows the best maximum likelihood estimator for both rQG0 and γ as free parameters. We obtain ﹩{r}_{0}^{\mathrm{QG}}\,=6.93\,{h}^{-1}\,\mathrm{cMpc}﹩ and ﹩\gamma =2.4﹩. The dashed black line shows the theoretical expectation of ﹩\chi ({R}_{\min },{R}_{\max })﹩ for the six stacked fields calculated from the independently determined QSO and LBG auto-correlation functions, assuming a deterministic bias model.
Other Images in This Article
Show More
Copyright and Terms & Conditions
© 2017. The American Astronomical Society. All rights reserved.
Copyright ©
2025 Astronomy Image Explorer. All Rights Reserved.