Image Details
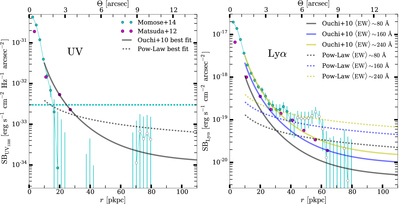
Caption: Figure 4.
Left panel: radial UV surface brightness profiles with physical distance from the central galaxy for the fiducial (solid gray line) and the power-law (dashed line) models, reduced by a factor of three and two, respectively, to better fit the data. Magenta and cyan dots, line, and bars denote the data as in Figure 2. Right panel: predicted Lyα surface brightness profiles for the two models in the left panel assuming different population-averaged Lyα EW (rest frame). The profiles with ﹩\langle \mathrm{EW}\rangle \sim 80\,\mathring{\rm{A}} ﹩ correspond to the “best-fit” profiles in the left panel assuming the same escape fraction for Lyα and UV.
Other Images in This Article
Copyright and Terms & Conditions
© 2017. The American Astronomical Society. All rights reserved.