Image Details
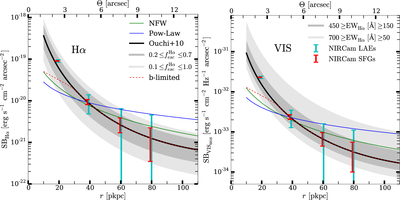
Caption: Figure 3.
Left panel: radial Hα surface brightness profiles predicted by our different models. Lines and colors are the same as in Figure 2. The two shaded areas display the regions ﹩0.2\leqslant {f}_{\mathrm{esc}}^{{\rm{H}}\alpha }\leqslant 0.7﹩ and ﹩0.1\leqslant {f}_{\mathrm{esc}}^{{\rm{H}}\alpha }\leqslant 0.1﹩ for the fiducial model (black solid line). The blue (red) error bars indicate the values and uncertainties for the predicted observations of halos around LAEs (SFGs) described in Section 3.3.1 (Section 3.3.2). Right panel: same as in the left panel but considering the visible continuum emission at ﹩6816\,\mathring{\rm{A}} ﹩ rest frame, computed assuming ﹩{\mathrm{EW}}_{{\rm{H}}\alpha }=300\,\mathring{\rm{A}} ﹩. The shaded areas represent the ranges ﹩450\geqslant {\mathrm{EW}}_{{\rm{H}}\alpha }\,[\mathring{\rm{A}} ]\geqslant 150﹩ and ﹩700\geqslant {\mathrm{EW}}_{{\rm{H}}\alpha }\,[\mathring{\rm{A}} ]\geqslant 50﹩ for the fiducial model. The red and blue data points at r = 20 pkpc fall slightly above the solid black line due to averaging the signal around such a steep regions. The red vertical lines have been slightly shifted from their original position to facilitate the visualization.
Other Images in This Article
Copyright and Terms & Conditions
© 2017. The American Astronomical Society. All rights reserved.