Image Details
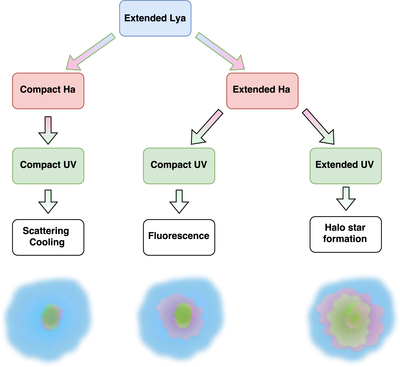
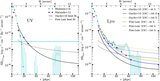
Caption: Figure 6.
Flow chart and plots representing the effect of the different radiative processes on the diffuse extended halos. The left plot displays extended Lyα emission only in blue, indicative of significant scattering and/or cooling effects. The middle plot shows a larger extent for the Hα emission than that of the continuum (red and green, respectively), implying a contribution of fluorescence. The right plot shows extended emission for all cases, indicating the presence of star formation beyond the central galaxy.
Other Images in This Article
Copyright and Terms & Conditions
© 2017. The American Astronomical Society. All rights reserved.
Copyright ©
2024 Astronomy Image Explorer. All Rights Reserved.