Image Details
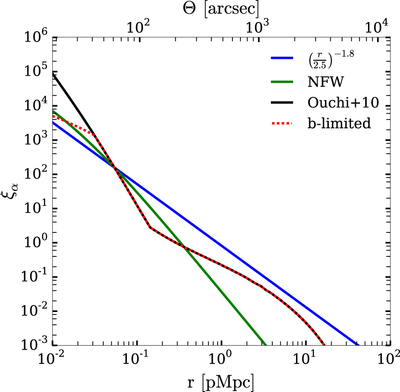
Caption: Figure 1.
Lyα emission correlation functions as a function of distance from the central galaxy for different clustering models. The solid black line denotes our fiducial model, derived by extrapolating observational constraints on the scale-dependent bias by Ouchi et al. (2010). The dashed red curve displays the same model, but with the bias limited to a value 10 (the maximum value inferred by Ouchi et al. 2010) . The blue line indicates the common power-law clustering of LAEs at redshift ﹩z\sim 3﹩. The green line denotes the NFW profile (see the text).
Other Images in This Article
Copyright and Terms & Conditions
© 2017. The American Astronomical Society. All rights reserved.
Copyright ©
2026 Astronomy Image Explorer. All Rights Reserved.