Image Details
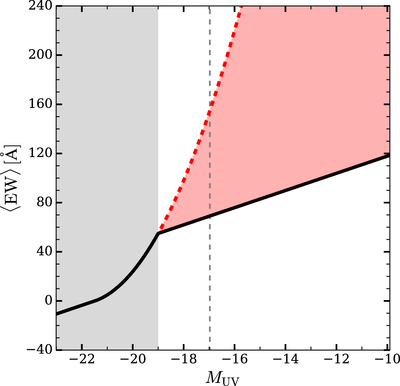
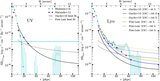
Caption: Figure 5.
Mean Lyα rest-frame equivalent width, ﹩\langle \mathrm{EW}\rangle ﹩, as a function of ﹩{M}_{\mathrm{UV}}﹩, parameterized following the fitting formula by Dijkstra & Wyithe (2012; solid black line), and extrapolating the evolution observed by Stark et al. (2010) within the range ﹩-19\gtrsim {M}_{\mathrm{UV}}\gtrsim -22﹩ (dashed red line). The red and the gray shaded areas represent the regions between the two evolutions and where the model is constrained by observations, respectively, and the dashed vertical line denotes the current observational limit, ﹩{M}_{\mathrm{UV}}=-17﹩, corresponding to ﹩\langle \mathrm{EW}\rangle =69﹩ Å. This figure shows that the modest extrapolation of the observed evolution of ﹩\langle \mathrm{EW}\rangle ﹩ with ﹩{M}_{\mathrm{UV}}﹩ by Dijkstra & Wyithe (2012) can partially account for simultaneously reproducing the observed surface brightness profiles of UV and Lyα halos, while steeper evolutions are required for a complete match.
Other Images in This Article
Copyright and Terms & Conditions
© 2017. The American Astronomical Society. All rights reserved.