Image Details
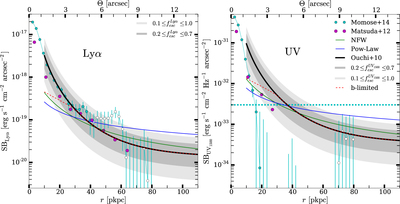
Caption: Figure 2.
Left panel: radial Lyα surface brightness profiles with physical distance from the central galaxy for different models. Lines and colors refer to the same models as in Figure 1. Magenta points denote an estimation of the data for the LAE overdensity range ﹩2.5\lt {\delta }_{\mathrm{LAE}}\lt 5.5﹩ in Matsuda et al. (2012). The cyan dots and bars represent the mean values and uncertainties from the observations at z = 3.1 by Momose et al. (2014), respectively. White dots indicate the regions where the measurements are not reliable due to systematic effects. The fiducial model is denoted by the solid black line considering ﹩{f}_{\mathrm{esc}}^{\mathrm{Ly}\alpha }=0.4﹩, and the two shaded areas display the regions ﹩0.2\leqslant {f}_{\mathrm{esc}}^{\mathrm{Ly}\alpha }\leqslant 0.7﹩ and ﹩0.1\leqslant {f}_{\mathrm{esc}}^{\mathrm{Ly}\alpha }\leqslant 1.0﹩ for the same model. Right panel: UV surface brightness profile. Lines and symbols are the same as in the left panel. The horizontal dashed cyan line indicates the region below which systematic effects in the observational data by Momose et al. (2014) are important. The two shaded areas display the regions within the same ﹩{f}_{\mathrm{esc}}^{\mathrm{UV}}﹩ ranges as for Lyα around the fiducial model.
Other Images in This Article
Copyright and Terms & Conditions
© 2017. The American Astronomical Society. All rights reserved.