Image Details
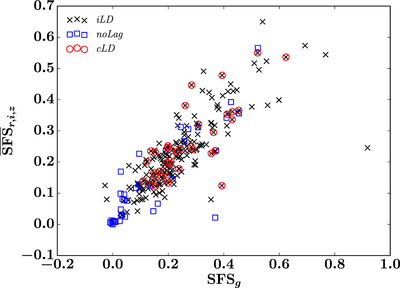
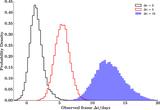
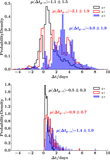
Caption: Figure 9.
Distributions of structure function slope (SFS) for the g-band light curves and the mean SFS for light curves in ﹩r,i,z﹩ bands. The black crosses, red circles, and blue squares are for samples iLD, cLD, and noLag, respectively, as explained in Table 2.
Other Images in This Article

Show More
Copyright and Terms & Conditions
© 2017. The American Astronomical Society. All rights reserved.
Copyright ©
2025 Astronomy Image Explorer. All Rights Reserved.