Image Details
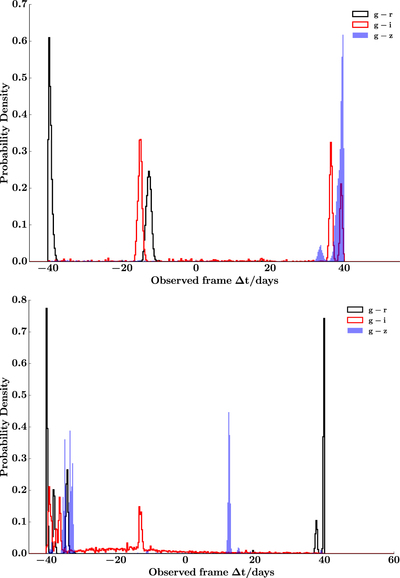
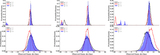
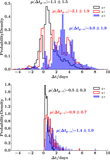
Caption: Figure 4.
Probability density distributions of lags in the observed frame between the actual g-band data and randomly generated mock light curves in r, i, and z bands as described in Section 3.2. The top panel is for quasar J022020.02–034331.1 in MD01, while the bottom panel is for quasar J221917.01–000757.5 in MD09.
Other Images in This Article

Show More
Copyright and Terms & Conditions
© 2017. The American Astronomical Society. All rights reserved.
Copyright ©
2025 Astronomy Image Explorer. All Rights Reserved.