Image Details
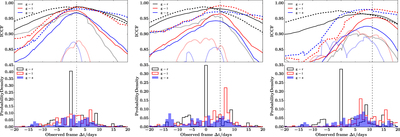
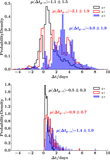
Caption: Figure 7.
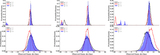
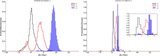
Top: interpolated cross-correlation coefficient (ICCF) between the mock g- and r-, i-, z-band light-curves. The solid lines use all the data points, while the dashed and dotted lines are based on the first or second half of the data, to show the variations in the ICCF. Bottom: probability density distributions of lags calculated based on the centroid of ICCF as described in Section 3.3. This experiment is done for quasar J022020.02–034331.1 as in the bottom panel of Figure 6. From left to right, the mock r-, i-, and z-band light curves are shifted by 2, 5, and 11 days as indicated by the vertical dashed line.
Other Images in This Article

Show More
Copyright and Terms & Conditions
© 2017. The American Astronomical Society. All rights reserved.