Image Details
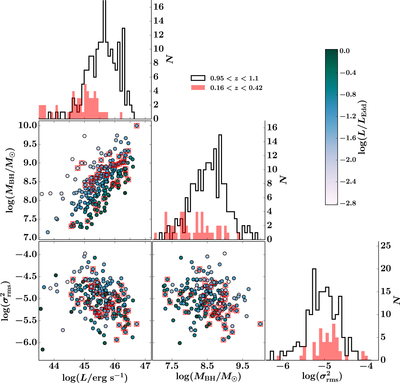
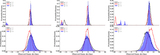
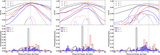
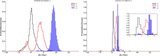
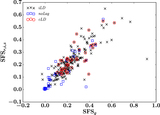
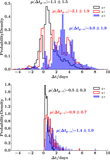
Caption: Figure 2.
Distributions of the estimated bolometric luminosity L, black-hole mass ﹩{M}_{\mathrm{BH}}﹩, and normalized g-band excess variance ﹩{\sigma }_{\mathrm{rms}}^{2}﹩ for the 200 quasars with detected lags. Each quasar is color coded by Eddington ratio. The 39 quasars with significant detections (subsample cLD) are labeled by the open red squares. The diagonal panels are the histograms of L, ﹩{M}_{\mathrm{BH}}﹩, and ﹩{\sigma }_{\mathrm{rms}}^{2}﹩ in the two redshift bins.
Other Images in This Article

Show More
Copyright and Terms & Conditions
© 2017. The American Astronomical Society. All rights reserved.
Copyright ©
2025 Astronomy Image Explorer. All Rights Reserved.