Image Details
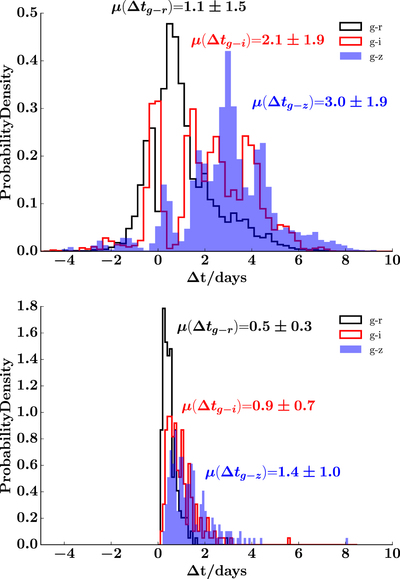
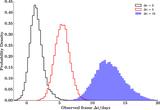
Caption: Figure 10.
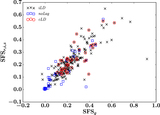
Top: stacked histograms of lags between g and ﹩r,i,z﹩ bands for the whole sample. The lags are measured in the rest frame of the quasars. The probability density is normalized such that the total area under each histogram is one. The averaged lags for each histogram are labeled in the figure. Bottom: histograms of the theoretically estimated lags between g and ﹩r,i,z﹩ bands based on the standard thin disk model as described in Section 4.5, using the estimated black-hole mass and bolometric luminosity for each quasar.
Other Images in This Article

Show More
Copyright and Terms & Conditions
© 2017. The American Astronomical Society. All rights reserved.
Copyright ©
2025 Astronomy Image Explorer. All Rights Reserved.