Image Details
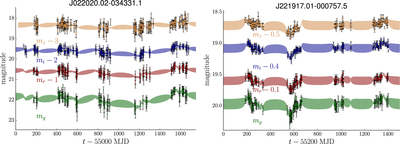
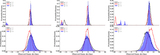
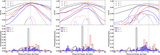
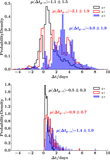
Caption: Figure 3. The g, r, i, and z band light curves
The complete figure set (200 images) is available in the online journal.
Example light-curves in the g, r, i, and z bands for the two sample quasars J022020.02–034331.1 in MD01 and J221917.01–000757.5 in MD09. The shaded region is the weighted mean of JAVELIN light curves that are consistent with the data and the ﹩1\sigma ﹩ dispersion of those light curves. Light curves for the full sample with JAVELIN fits are available online.
Other Images in This Article

Show More
Copyright and Terms & Conditions
© 2017. The American Astronomical Society. All rights reserved.
Copyright ©
2025 Astronomy Image Explorer. All Rights Reserved.