Image Details
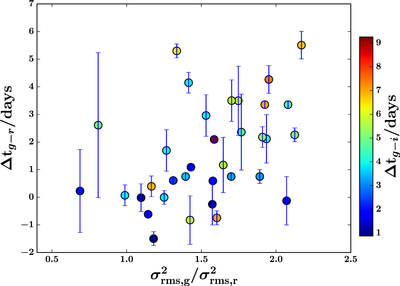
Caption: Figure 15.
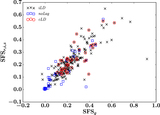
Correlation of g − r lags (﹩{\rm{\Delta }}{t}_{g-r}﹩) with the average ratio between the excess variance in the g (﹩{\sigma }_{\mathrm{rms},g}^{2}﹩) and r (﹩{\sigma }_{\mathrm{rms},r}^{2}﹩) bands for the 39 cLD quasars. Each data point is color coded by the g − i lags (﹩{\rm{\Delta }}{t}_{g-i}﹩).
Other Images in This Article

Show More
Copyright and Terms & Conditions
© 2017. The American Astronomical Society. All rights reserved.
Copyright ©
2025 Astronomy Image Explorer. All Rights Reserved.