Image Details
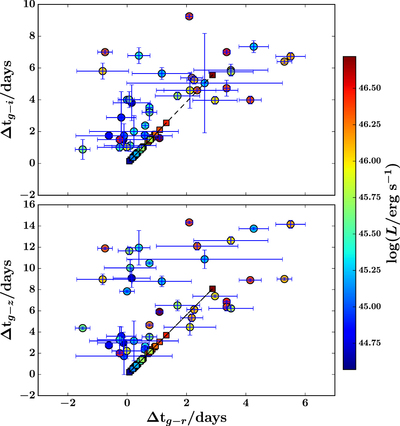
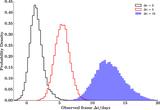
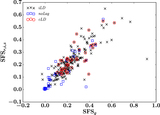
Caption: Figure 14.
Distributions of g − r lags for the subsample cLD with respect to g − i (top panel) and g − z (bottom panel) lags. Each data point is color coded with the bolometric luminosity. The filled squares connected by the dashed lines are theoretically calculated lags according to Equation (2).
Other Images in This Article

Show More
Copyright and Terms & Conditions
© 2017. The American Astronomical Society. All rights reserved.
Copyright ©
2025 Astronomy Image Explorer. All Rights Reserved.