Image Details
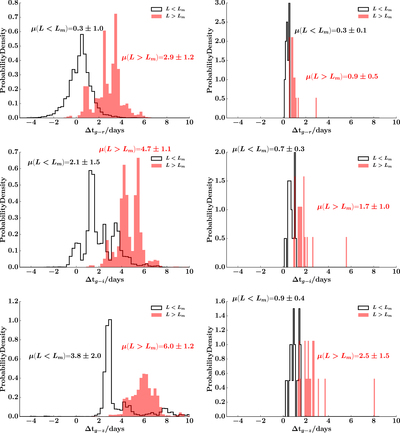
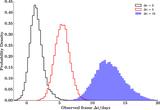
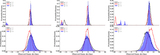
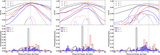
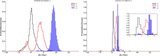
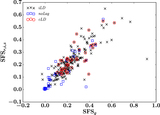
Caption: Figure 13.
Left: stacked histograms of the lags between the g-band and the other bands, when the 39 cLD quasars with significant, consistent lag detections are divided into two subsamples based on the median luminosity Lm. The solid black line is the subsample with ﹩L\lt {L}_{m}﹩, while the dashed red line is the subsample with ﹩L\gt {L}_{m}﹩. Right: histograms of the theoretically estimated lags between the g and other bands for the two subsamples divided by luminosity in the same way. From top to bottom, the three rows are for lags between g − r, g − i, and g − z bands respectively.
Other Images in This Article

Show More
Copyright and Terms & Conditions
© 2017. The American Astronomical Society. All rights reserved.
Copyright ©
2025 Astronomy Image Explorer. All Rights Reserved.