Image Details
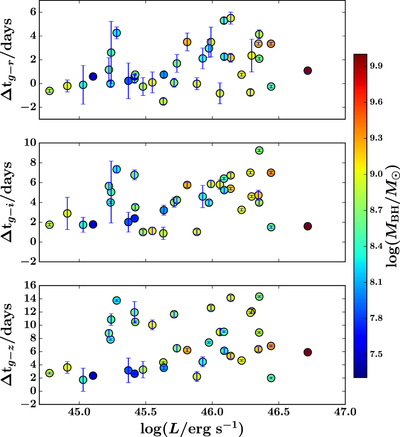
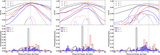
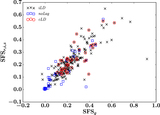
Caption: Figure 12.
Distributions of lag with luminosity for the 39 cLD quasars with significant, consistent detections. Each data point is color coded by the estimated black-hole mass. From top to bottom, the three panels are rest frame lags between g − r, g − i, and g − z bands respectively. The dashed black lines in each panel indicate 0 lags.
Other Images in This Article

Show More
Copyright and Terms & Conditions
© 2017. The American Astronomical Society. All rights reserved.
Copyright ©
2025 Astronomy Image Explorer. All Rights Reserved.