Image Details
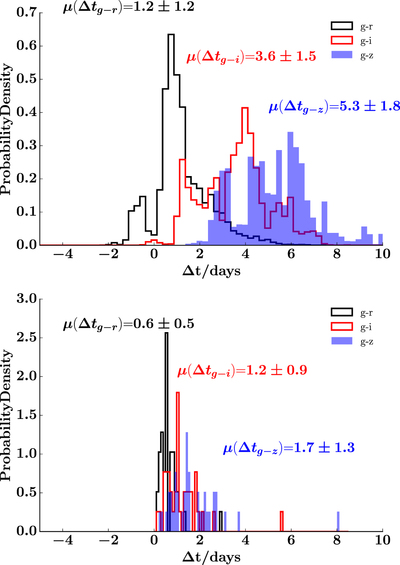
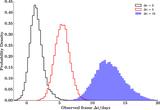
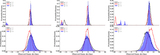
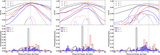
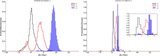
Caption: Figure 11.
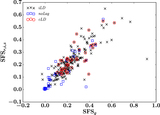
Top: stacked histograms of lags between g and ﹩r,i,﹩ z bands for the selected subsample cLD. Bottom: histograms of the theoretically estimated lags between g and ﹩r,i,z﹩ bands for this subsample.
Other Images in This Article

Show More
Copyright and Terms & Conditions
© 2017. The American Astronomical Society. All rights reserved.
Copyright ©
2025 Astronomy Image Explorer. All Rights Reserved.