Image Details
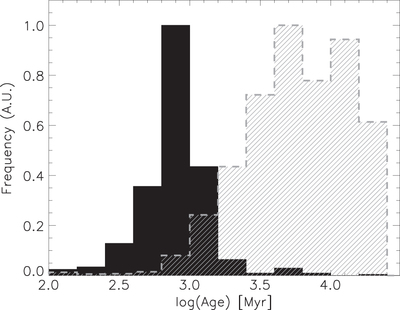
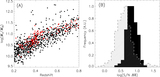
Caption: Figure 6.
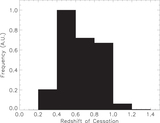
Single burst, simple stellar population equivalent age distribution determined from fitting models to the spectra of galaxies in the total sample. The solid black histogram is the age distribution of the E+A galaxies in the total sample (see text for sample definition). The gray, hashed histogram is the age distribution of galaxies in the complementary (excluding E+A galaxies) total sample.
Other Images in This Article

Show More
Copyright and Terms & Conditions
© 2016. The American Astronomical Society. All rights reserved.
Copyright ©
2025 Astronomy Image Explorer. All Rights Reserved.