Image Details
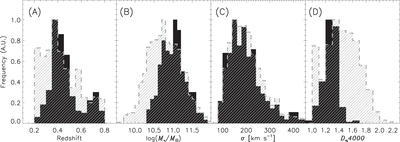
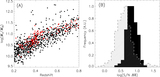
Caption: Figure 3.
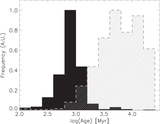
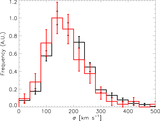
(A) Redshift, (B) stellar mass (C) velocity dispersion and (D) Dn4000 distribution of the point source parent (gray dashed, hashed) and E+A samples (solid black). The peak value of the histograms are normalized to unity.
Other Images in This Article
Show More
Copyright and Terms & Conditions
© 2016. The American Astronomical Society. All rights reserved.
Copyright ©
2025 Astronomy Image Explorer. All Rights Reserved.