Image Details
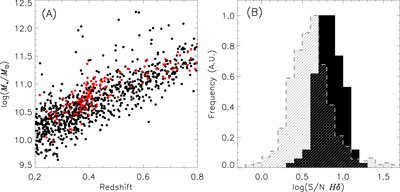
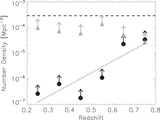
Caption: Figure 10.
(A) Stellar mass of the BOSS point source sample as a function of redshift. The black points show the parent sample, and the red points are E+A galaxies. (B) The empirically determined S/N of the continuum measured in two windows adjacent to the Hδ absorption line. The solid black and gray hashed histograms are the S/N distributions for the BOSS point source and the E+A and complementary parent samples, respectively.
Other Images in This Article

Show More
Copyright and Terms & Conditions
© 2016. The American Astronomical Society. All rights reserved.
Copyright ©
2025 Astronomy Image Explorer. All Rights Reserved.