Image Details
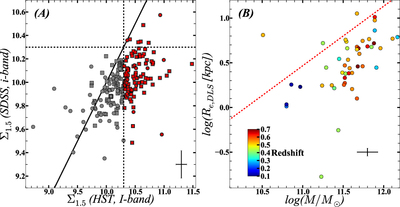
Caption: Figure 1.
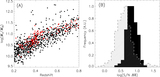
(A) Compact classification of the same 202 galaxies based on SDSS and HST sizes (Sargent et al. 2007; Griffith et al. 2012). The dotted lines show the compact galaxy classification of B13 and the solid line is the one-to-one relation. The typical error is shown in the lower right. Due to the lack of uniform spectroscopy for this sample, quiescent galaxies are selected based on rest-frame colors. (B) The size vs. mass diagram for 47 galaxies classified as compact based on SDSS photometry but with sizes remeasured using higher quality imaging from the DLS (see text for detail). The red dotted line is the B13 compact galaxy classification. The typical error bars are shown in the lower right. For this comparison, quiescent galaxies are selected based on Dn4000 (>1.5).
Other Images in This Article

Show More
Copyright and Terms & Conditions
© 2016. The American Astronomical Society. All rights reserved.