Image Details
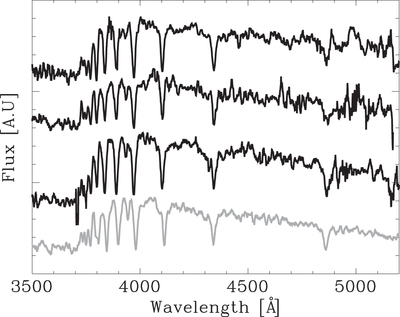
Caption: Figure 5.
Rest-frame spectra of the four galaxies observed with HST. The top three spectra correspond to the galaxies shown in Figure 4 plotted in the same order from top to bottom. The gray spectrum is the E+A galaxy, which is unresolved in HST WFC3 imaging. The spectra are presented in the same order from top to bottom as the object properties given in Table 2.
Other Images in This Article

Show More
Copyright and Terms & Conditions
© 2016. The American Astronomical Society. All rights reserved.
Copyright ©
2025 Astronomy Image Explorer. All Rights Reserved.